


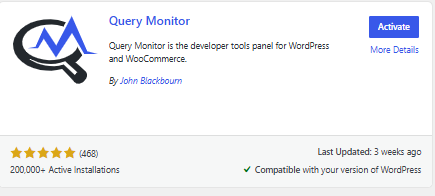
Query Monitor is a debugging plugin for WordPress that provides information about database queries, PHP errors, HTTP requests, hooks, and performance. It can help identify slow pages, plugin conflicts, and technical issues that are difficult to diagnose from the WordPress dashboard alone.
Because Query Monitor displays technical information, it is primarily intended for troubleshooting and development. In some cases, support teams may ask you to install it to collect additional details about a problem.
Table of Contents
What can Query Monitor show?

Query Monitor collects diagnostic information about your website and displays it directly in the WordPress administration panel.
Depending on the page you are viewing, it can show:
- Database queries and their execution times.
- PHP warnings and errors.
- HTTP API requests.
- Loaded scripts and stylesheets.
- Hooks and actions executed by WordPress.
- Information about plugins and themes.
- Memory usage and page generation time.
This information can help determine whether a plugin, theme, or database operation is affecting your website’s performance.
How to install Query Monitor
- Log in to your WordPress administration panel.
- Go to Plugins → Add New Plugin.
- Search for Query Monitor.
- Click Install Now.
- Click Activate.
After activation, a new Query Monitor menu will appear in the administration toolbar.
How to open Query Monitor
- Open any page while logged in to WordPress.
- Look for the Query Monitor menu in the top administration bar.
- Click the menu to open the diagnostic panel.

The toolbar item displays basic information, such as:
- Total page generation time.
- Number of database queries.
- PHP memory usage.
- Any detected errors or warnings.
Selecting the menu opens the full report.

How to check slow database queries
Database queries are one of the most common causes of slow WordPress pages.
To review them:
- Open Query Monitor.
- Select the Queries tab.
- Sort the list by execution time.
- Review any queries that take an unusually long time.
Query Monitor also shows which plugin, theme, or WordPress component generated each query.
How to identify plugin and theme issues
If a page becomes slow or starts displaying errors after installing a plugin or theme:
- Open the affected page.
- Open Query Monitor.
- Review the PHP Errors tab.
- Review the Queries by Component tab.
- Look for plugins or themes that generate errors or unusually high numbers of queries.
A large number of slow queries or repeated errors may indicate that a plugin requires further investigation.
How to check API requests
Some plugins communicate with external services such as payment providers, analytics platforms, or email services.
To inspect these requests:
- Open Query Monitor.
- Select the HTTP API Calls tab.
- Review the requests and response times.
Slow or failed requests may affect the behavior of your website.
Important considerations
Query Monitor is designed for troubleshooting and development. While active, it collects diagnostic information that may slightly affect performance.
For this reason:
- Use the plugin only when investigating a problem.
- Avoid leaving it active permanently on busy websites.
- Do not share screenshots that contain sensitive information.
- Deactivate the plugin after troubleshooting is complete.
Visitors who are not logged in to WordPress cannot see the information displayed by Query Monitor.
What to expect
Query Monitor can help identify performance issues and technical errors, but it does not automatically fix them. The plugin provides diagnostic information that can help you or your support team understand how WordPress behaves behind the scenes.
If support requests Query Monitor data, include screenshots of the relevant tabs and describe the steps that led to the issue.